Issuu Academy: Analytics
Dec 18th, 2020 by October GunawanYou’ve uploaded your content onto Issuu, made Article and Visual Stories, and shared it out with the world. But short of re-shares on social media, how do you know how your content is performing?
In comes the concept of analytics, or “The systematic computational analysis of data or statistics” (Lexico). More simply put, it is using statistics and data to see if your content is leading to desired results and end behaviors. You can learn more about analytics here.
Issuu Statistics is a feature that provides such data for Issuu publishers. Craig Kingsbury, Senior Customer Success Manager and Unicycle Enthusiast, and Tina Nguyen, Customer Success Specialist and Reality TV Junkie have been taking turns doing a weekly 3-Day workshop series called Issuu Academy where they cover topics from Getting Started to using Issuu Statistics.
This will be an overview of the Issuu Statistics segment.
General Performance
To see a broad overview of your account performance, from your home page, go to the left-hand menu and find “Statistics” or click here.

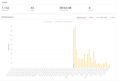
At first glance, there is a lot of information to take in, so let’s go through the segments step-by-step.
1. Filtering
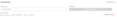
The Issuu Statistics page has defaults for a quick performance overview, but each field can be customized to be more specific or broad.
The first default is seeing the performance of all publications ever uploaded on your account. In the dropdown menu, you can specify one of your ten most recent publications instead if you’d like to see its individual performance. (If you want to look at a publication older than the last ten, we will cover that further down.)

Next, you can check the performance of your account or publication over time. It defaults to the past 30 days, where days begin at midnight UTC and has shortcuts for the last 6 months, 7 days, or all time. If needed, you can customize the date range as well.

You can also specify what format of content to analyze. The graph defaults to show all three: publications, article stories, and visual stories but is able to be narrowed down to two or even a single format as shown below.
Should you need to share the data within these fields (all or a specific publication, within a period of time, in all or certain formats), you can download a .csv file by clicking the “Download” button.

As seen above, the Issuu Statistics feature does help disseminate the data with visuals such as graphs. Charts, numerical summaries, and more are available as well.
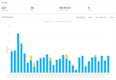
2. Data and Statistics
Some terms might not be familiar, so here are some definitions to remember:
Impressions are the number of times that your publication was shown on the Issuu network, whether as a thumbnail in a feed, in search results or on websites with the content embedded.
Reads are counted when your publication is opened and a user performs an action by flipping the page, zooming, etc., or stays for more than two seconds.
Read Time is counted once the content has loaded for more than two seconds ie. when it is considered a Read. This applies to specific pages. It will be presented in the hours:minutes:seconds format.
Average Read Time is the individual read times summed up and divided by the content total.
Clicks are the number of times on average readers click on links in your content.
This gives a general overview of how your account or a single recent publication is doing. Furthermore, you can see how readers are accessing your content. Reading Devices are the hardware type used to access it. There are three kinds of devices: Desktop (aka computers), Tablet, and Phone. Sources shows if readers are viewing the content directly on Issuu or through an embed. If they are viewing it from the Shareable Full-Screen Reader it counts as coming from an embed.


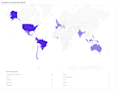
Finally, there is a map called Readers Around the World that visualizes the basic data point of location of readers of your content. Issuu illustrates the concentration of readers in each active area with how dark it appears on the map. It also specifies how many readers in each area there are in the period of time selected. Currently, data only exists by country.
Specific Performance
Should you want to see the performance of older publications or desire more specific data points, you can do so by selecting a publication as usual (from the home page, select “Publications” or click here, then locate the desired publication).

From the publication page, once more pan to the left-hand menu and click on “Statistics” which will take you to a URL that looks like this: https://issuu.com/home/published/**PUBLICATION NAME**/statistics.

The following statistics page is similar to the previous one but has a few bits of information that the general performance overview does not cover.
First, should links exist in your publication, the Links section of this page will show how many times they were clicked. Unfortunately, we cannot specify which links were clicked, only the page where links were clicked.
If you need to know, for example, how specific ads performed in your content, we recommend using Google Analytics. Especially useful is their Campaign URL Builder.
Next, you can see page-by-page performance under Pages.
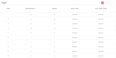
Reading Devices, Sources, and Readers Around the World are shown the same way here as they are in General Performance Overview, but with the more narrow statistics of a single publication.
Statistics and data provided by the Issuu Statistics feature can guide your team on what is and is not “working”. Utilizing analytics will help further understand and influence your readers and consumers.
To learn more in-depth about Issuu Statistics and ask any questions about how to use it, please join Craig or Tina in the Thursday workshop segment “Issuu Statistics and General Q&A”.